
Propagation
(page
reloads every 12 minutes)
| SolMon |
Geomagnetic Field A |
Geomagnetic Field Kp | Solar X-ray status | Proton status | Neutron Event status |
| Local Data: |  |
 |
 |
 |
 |
| Last changed: | 2026-06-17 08:58:59Z |
2026-06-17 08:58:59Z |
2026-06-17 08:59:10Z |
2026-06-17 08:59:08Z |
2026-06-17 08:59:08Z |
| N3KL |
Geomagnetic Field | Solar X-ray status |
| Data Derived: |  |
 |
| Zone |
Current |
Forecast
(6hr) |
| POLar |
 |
: Polar") |
| AURoral |
 |
: Auroral") |
| SUBauroral |
 |
: Sub-Auroral") |
| SolMonCA |
Current | +6hr | +24hr |
| POL / AUR / SUB Data |  |
 |
 |
 |
|||
iSWA -
Integrated Spaceweather Analysis system
| Radio Blackouts (R) |
| Solar
Radiation Storms (S) |
| Geomagnetic Storms (G) |


This shows, no matter what, about 200 different entities are available every week.
The graphed data could contain "Pirate/SLIM" operations or "busted" callsigns.
You never know. So 'Work First Worry Later'.
This data is now Open Source. You can download here, in .ods format (LibreOffice Calc)
ACE Magnetic Field data 7d 3d 24h 6h 2h
Combined data F:113 A:6 K:1.33 SSN:76 2026-06-17 09:00:04Z
 |
|
 |
|
 |
 |
| Full SSN forecast page |
|
 |
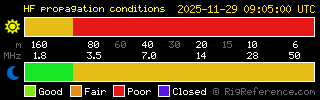
Divide the number shown here by 100 to calculate the number of MHz that MUF is up or down compared to the last 60 days at the current time. Updates every 15 minutes. Raw data: Wallops Island VA, San Juan PR & Boulder CO ionosondes. |
Rigreference data
F6GCI solar data page
F5LEN solar forecast
X-ray plot (1min/3d) and X-ray plot (1min/6h)
Kp Index Plot(3h/3d)
Space Weather Now (NWS)
eSSN (24hrs)
Space Weather
Space Weather Canada Penticton Solar Flux
Sun Nearside & FARSIDE images: 1 | 2 | 3 (SOHO/MDI, SOHO/SWAN, SOHO/SWAN)
Latest SOHO images
Forecast based on current data*
Active Region Monitor
STORM Ionospheric correction factors
Coronal Mass Ejection movie**
WARNINGS currently in effect
Current D layer Absorption
Real Time MUF
VRML (3D) view of Coronal fields* (VRML viewer required)
Mount Wilson Sunspot Count note this is drawn "backwards"
DXRobot (GoodDX)
The Lookers Blog
DXAnywhere Figures*
*Broadband required * Huge memory resources needed for Flash * Try using: GIF Toggle add-on for Firefox or GIF Scrubber extension for Google Chrome
:Product: Geophysical Alert Message wwv.txt :Issued: 2026 Jun 17 0605 UTC # Prepared by the US Dept. of Commerce, NOAA, Space Weather Prediction Center # # Geophysical Alert Message # Solar-terrestrial indices for 16 June follow. Solar flux 113 and estimated planetary A-index 6. The estimated planetary K-index at 0600 UTC on 17 June was 1.33. No space weather storms were observed for the past 24 hours. No space weather storms are predicted for the next 24 hours. |
Magnetic field reversal now complete, the cycle has completed and should now be heading towards Cycle 25!
Did you know: The fuel consumption of the Sun is 5 million tonnes/sec.
|
|
|
|
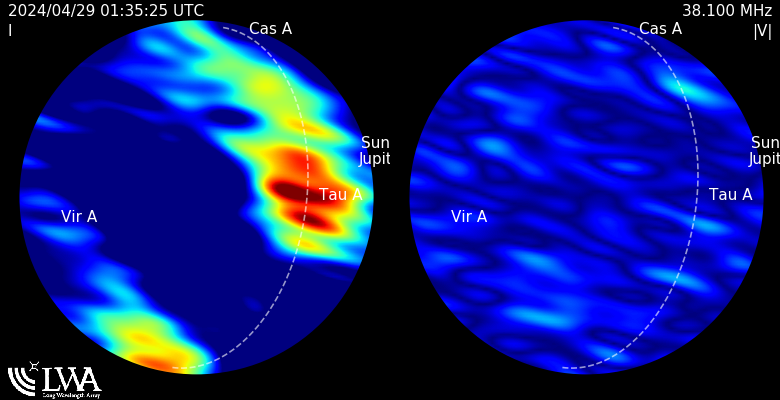
Nancay Not Real Time |
Nancay Not Real Time |
|
|
These real-time images follow around the above graphic, except that: EIT 284Å is an additional image VHF/UHF images are not taken in real-time |
|||
|
|
||||
|
|
||||
|
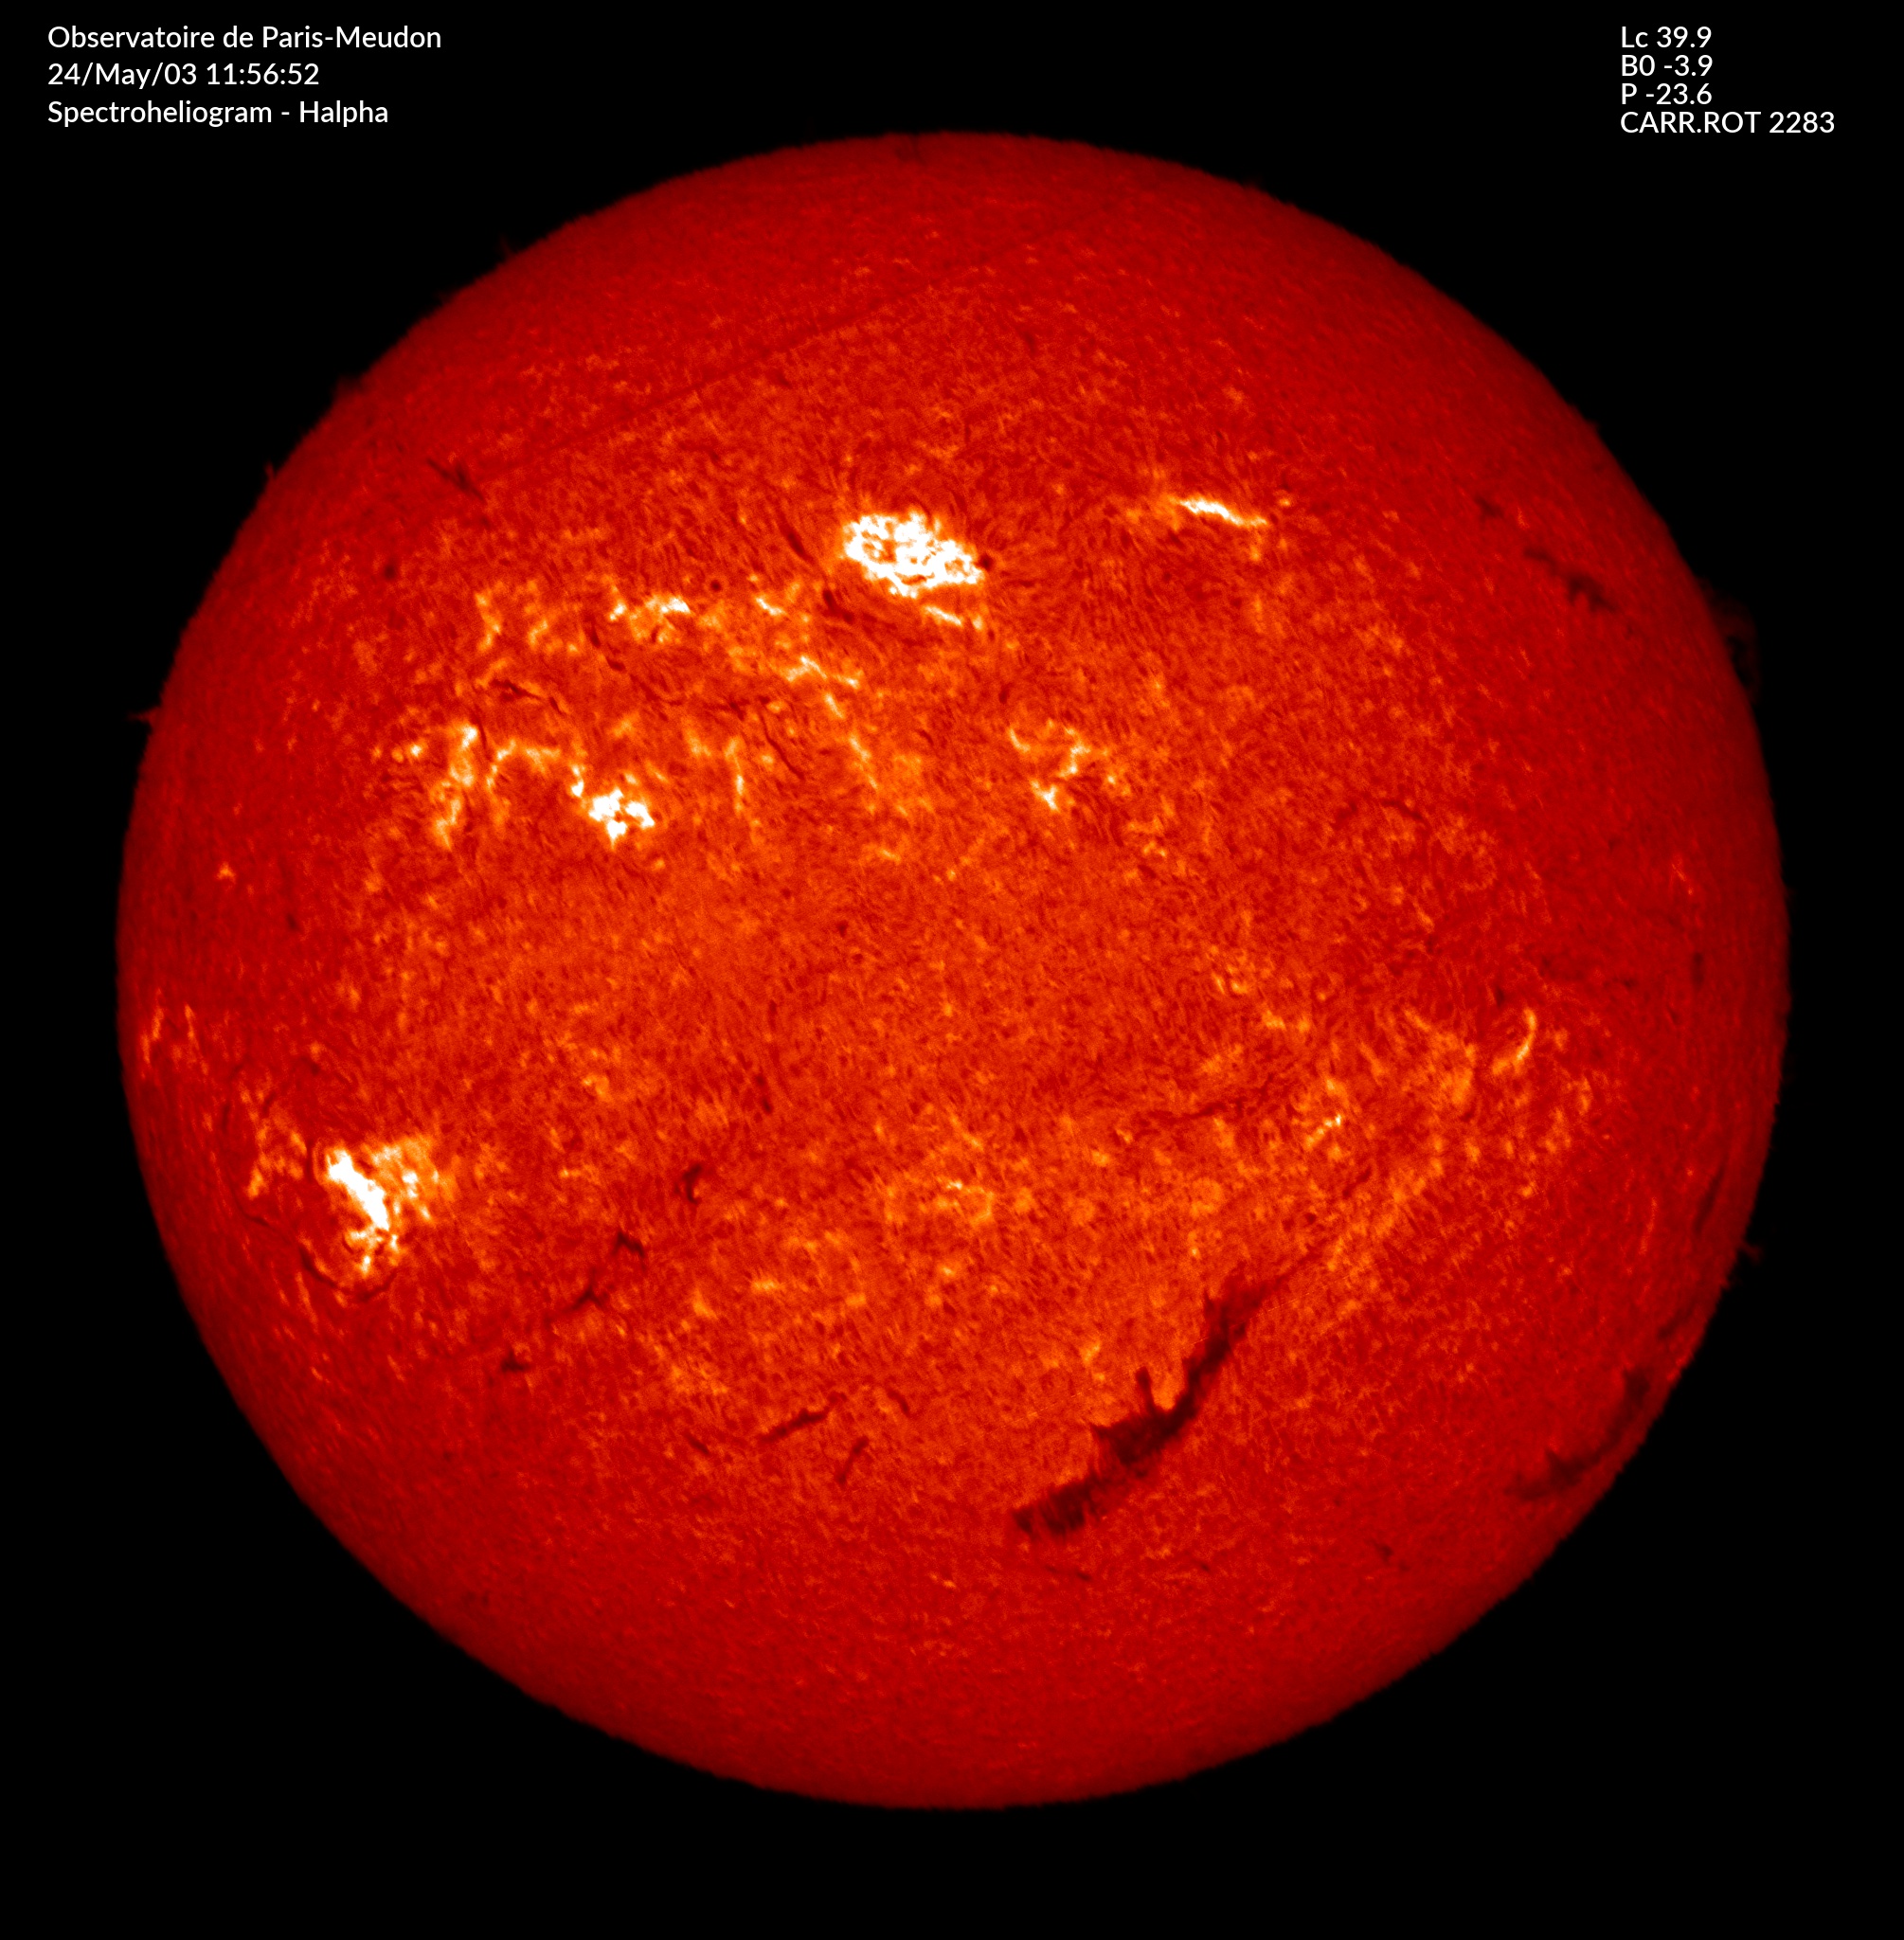
Meudon Hα 6563Å |
||||


 |
 |
| GOES-16 X-ray Flux (5 minutes) | GOES-16 X-ray Flux (1 minute) |
 |
 |
| GOES-16 Electron Flux (5 minutes) | GOES-16 Proton Flux (5 minutes) |
 |
 |
| K Index (3 hours) | Combined (1 minute) |
 |
 |
| GOES-16 Magnetometers (1 minute) | Boulder Magnetometer (1 minute) |
 |
 |
| 'Kiel' magnetometer ~location 1 minute resolution |
VLF 24kHz signal from NAA Cutler,Maine to
Louisville, Kentucky |
POES data and OVATION Aurora Prediction
 |
 |
| North
Pole - 3 day |
South
Pole - 3 day |
 |
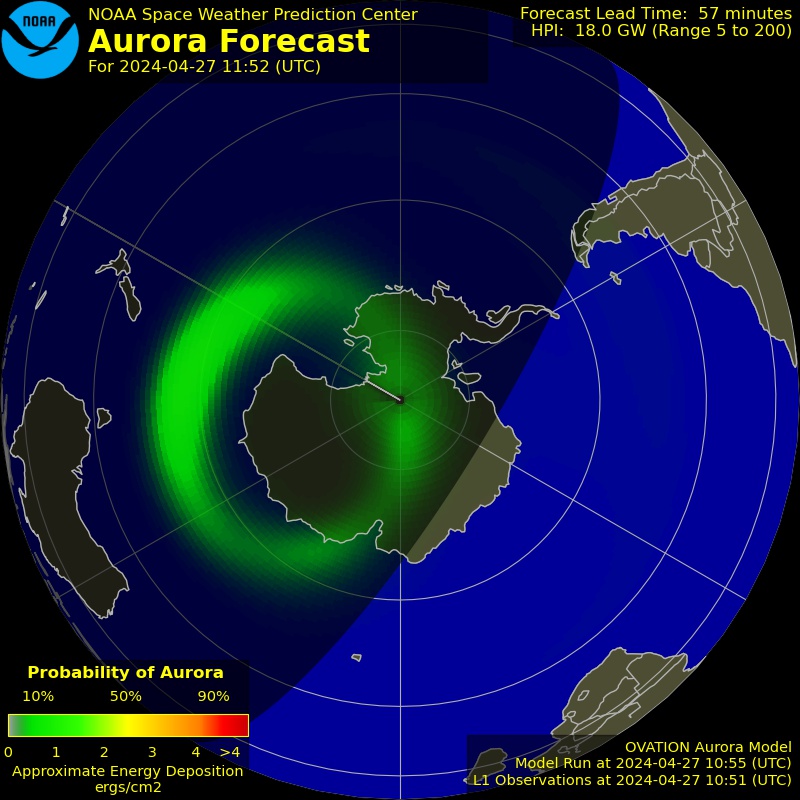 |
| North Pole forecast - 30 minutes |
South Pole forecast - 30 minutes |
From this vantage point Solar wind data can be detected about 45 to 60 minutes before reaching Earth.
 |
 |
| Front Side | Far Side |
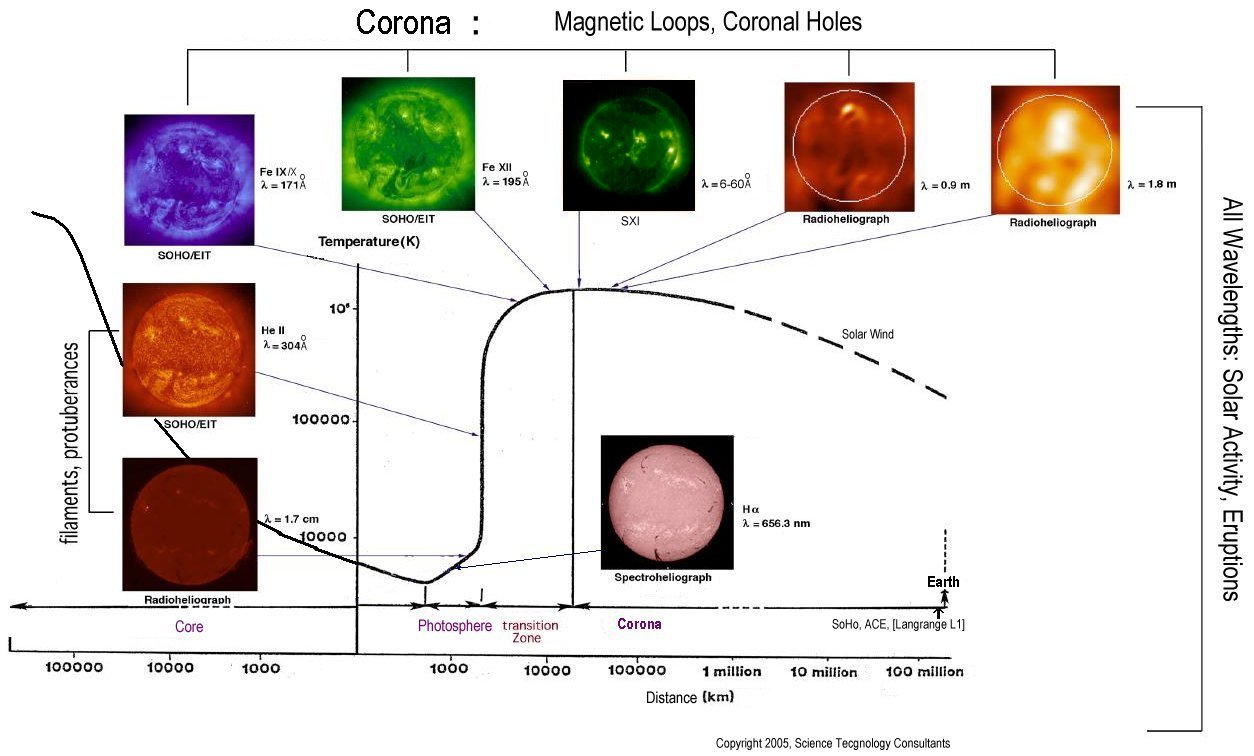
 Key to solar history above
|
 SDO - Soft X-ray image |
 |
 |
| SDO (straight-on view) [193Å] (SoHO 195Å) | STEREO-A - to the East (looking around back of Sun) |
Browse
Latest Images  |
STEREO - receiving the data. Between April and June 2015 the datalink didn't reach the Earth. Why? The angle B-Earth is gradually increasing, at the rate of about 0.3 degrees per month. When this gets too large, the signals had to graze the Sun to reach Earth. If the satellites survive ecllipse and the increasing solar activity, then they will remain extraordinary solar sentinals. Antenna pointing is restricted, so signal recovery may be marginal. -90°/+90°
coverage was achieved in February 2011. With SDO/SoHO that should
ensure
360° coverage until 2019 - or until instrument/probe failure or
de-funding occurs.
|
| STEREO
Information |
|
 |
|
 |
 |
| SDO Magnetogram | SDO MDI - Sunspot indications |
Cycle 23 (May 1996): In the sun's northern hemisphere, all spots were S-N. In the southern hemisphere, all spots were N-S.
Cycle 24 (Jan 2008): Northern sunspots are N-S while southern sunspots are S-N.
This reversal occurs each time one cycle gives way to the next. It is called Hale's Law.
 |
| SWAP EUV SoFAST flare detection |

Data on
this page courtesy of: esa/SOHO,
NASA, Solar Terrestrial Dispatch,
Stanford University (Solar Oscillations Investigation group),
spaceweather.com, NW Research Associates, NOAA/SWPC (Space Weather
Prediction Center),
Lockheed Martin (Solar & Astrophysics Laboratory)
Raben Systems, Inc., n2yo.com, Deep Space Network and the hundreds of
ground
support team
personnel involved in these projects.